
Editor's note: Last August, a recession indicator with a perfect track record flashed a warning. But Joel Litman – chief investment officer of our corporate affiliate Altimetry – says this signal may have been the first false positive in its history. In this piece, which he recently published in his free Altimetry Daily Authority e-letter, Joel explains why the stock market tends to perform well even after times like these...
For 76 years, unemployment has followed a similar pattern...
Once the unemployment rate was high enough, it caused the economy to spiral out of control.
I covered this trend in my e-letter quite a bit last year, specifically in regard to the Sahm Rule... a recession indicator created by former Federal Reserve economist Claudia Sahm.
The Sahm Rule tracks the three-month rolling average unemployment rate. If that rolling average climbs 0.5 percentage points above its one-year low, it's a sign that a recession has started.
In each of the 12 recessions since 1949, when the Sahm Rule triggered, it was just the beginning.
The rolling average surged well past 1 percentage point every time. It jumped as high as 9.5 percentage points during the pandemic.
However, Claudia Sahm herself has said that her rule is meant to be broken. And that might just be what we're seeing today...
A lot of folks were concerned when the Sahm Rule triggered last August... for good reason.
Up to that point, the rule had never generated a false positive or false negative signal.
But six months later, the economy and the stock market still seem OK. Unemployment has stagnated instead of accelerating.
And after peaking at 0.57 percentage points in August, the Sahm Rule has "untriggered," falling back to 0.4 percentage points.
Take a look...
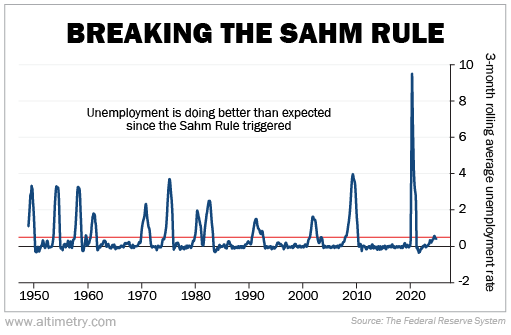
You can see on the chart that we're back to what's considered a "typical" unemployment rate.
Importantly, unemployment data can be "good" or "bad." During this most recent breach of the Sahm Rule, rising unemployment was the "good" kind. It was driven by more folks entering the workforce.
In a Bloomberg article last year, titled "My Recession Rule Was Meant to Be Broken," Claudia Sahm said this may have caused the most recent breach to be a false positive... since it wasn't driven by a huge uptick in layoffs.
Not to mention, investors don't need to worry about the Sahm Rule anyway...
We're being a bit tongue-in-cheek, of course. Everyone should pay attention to recession risk.
That said, the stock market tends to do pretty well after the Sahm Rule triggers. Take a look at the following chart put together by Macrobond...
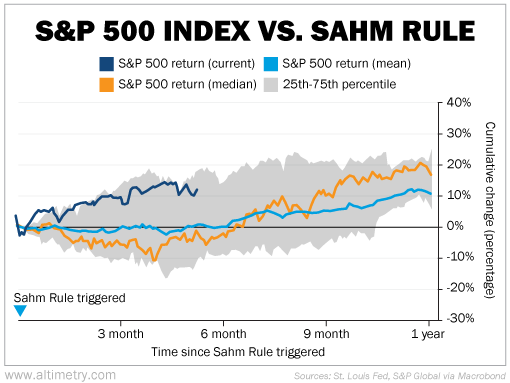
As you can see, when the Sahm Rule triggers, the S&P 500 Index finishes the following 12 months up 10% on average. The median is closer to 17%.
So far, the S&P 500 is up about 12% this time... well within the average range.
There's no guarantee that it will stay that way. But it's encouraging to see this trend could continue through the rest of the year, based on history.
With the latest jobs data so strong, the Fed is keeping interest rates higher than expected.
Fed Chair Jerome Powell suggested the bank will only cut rates twice this year. High rates could continue to put pressure on companies to manage costs through layoffs.
So we still need to keep a close eye on employment trends. Just because unemployment has settled down doesn't mean we're immune to a more typical unemployment cycle. We could still end up headed for a recession.
But we're seeing plenty of positive signs for the economy, too. Banks are on the cusp of loosening lending standards. And in January, we saw the yield curve for U.S. Treasury bonds flip back to "normal."
And if the Sahm Rule's recent trigger does turn out to be a false positive, that's more good news for the U.S. economy... and for the stock market.
Regards,
Joel Litman
Editor's note: Donald Trump has signed a record number of executive orders since reclaiming the Oval Office, leaving most investors wondering what will happen next...
But Joel has been waiting for a moment like this for 30 years. Trump's deregulatory shift will transform how companies report earnings, potentially unlocking huge gains in a select group of stocks... Discover how you can find these winners with Joel's system right here.
Further Reading
Today, the S&P 500 is roughly 35% more expensive than its long-term average. But if you're planning your investments for the year ahead, valuation isn't all that matters. And right now, we're seeing signs that the bull market will continue in 2025... Learn more here.
Every year, investment banks release their market projections... which typically turn out to be worthless. While it's useful to see what these banks think the year ahead holds, their outlook should never be the basis for your investments... Read more here.
