
The Weekend Edition is pulled from the daily Stansberry Digest.
*** The market is full of "rules"...
And despite what you may think, most of them don't actually work.
When it comes to most things, I'm not a contrarian for the sake of being a contrarian.
However, I'd estimate that 90% of what you hear from the financial media and investment managers can not only prevent you from making money... it could even cost you money.
In my 20-plus-year career, I've found several of the most popular rules to be totally worthless. Today, I'm going to share five investing principles that have treated investors right over the long term...
*** The first is the importance of being selective...
Between the New York Stock Exchange and the Nasdaq Composite Index, individual investors can choose between more than 6,000 U.S.-listed stocks. If you widen the scope to liquid stocks in international markets, that number is several times larger.
In addition, investors can also choose to put their money into bonds, exchange-traded funds, commodities, options, and more.
But in reality, a "diversified" portfolio only needs 10 stocks.
Having 10 stocks is perfect. It's enough to make sure a single loser doesn't sink your whole portfolio, and you'll also be able to keep track of each company you own.
Say it with me: Out of the thousands of options you face as an investor, you only need to hold 10 stocks in your portfolio. Be selective and only buy the absolute best.
Ideally, you'd make your highest-conviction ideas larger positions than the rest. But with a 10-stock portfolio, simply allocating 10% into each position is good enough for most investors.
You must also remember that 10-baggers don't happen overnight. For these kinds of returns, you want stocks that you can own for at least two or three years, and preferably a decade.
In my Empire Elite Trader service, I'm not typically looking for multibaggers. I take a shorter-term approach to the markets to consistently hit "singles" and "doubles" again and again, without taking much risk. Over time, they really add up...
*** The second principle has to do with extremes...
In professional sports, teams need to either be great (with a chance to win the title) or terrible (with a chance to get the best available players in the draft to ultimately grow into a title contender). For the best chance at long-term success, they can't live in the "middle."
It's the same thing when it comes to investing...
The "middle" only produces average returns. To beat the market, you need to focus on the extremes... and in particular, look for companies that are experiencing extreme earnings growth.
Another example of an extreme is buying assets for 10 cents on the dollar. This can be dangerous... and an easy way to light your money on fire. But when you're right, it can produce huge returns.
Extremes often show up in cyclical industries such as heavy equipment, which includes Caterpillar (CAT) and Deere (DE)... or in "protein stocks" like Tyson Foods (TSN) and Pilgrim's Pride (PPC). When companies in these industries reach record-high margins, they're often good candidates to sell short. When they reach record-low margins, they can generate fantastic returns on the long side.
*** The third rule that works is the concept of technical analysis...
Put simply, technical analysis means using price to analyze a stock.
While many investors value technical analysis, most professional investors reject it because it's not scientific enough, as if it's essentially investing "voodoo."
And yet, we've seen time and time again that technical analysis really works. Investors buy stocks, not companies. A stock's value is whatever price buyers and sellers can agree upon.
While we can't see every single buyer's and seller's activity, we can see the aggregate activity by looking at price and volume.
Properly analyzed, these data can tell us exactly what is happening to a stock. The problem is, most technical indicators are weak or even useless.
"Support" and "resistance" are two popular indicators that many traders use to get in or out of a position based on past prices. But they're not particularly powerful or useful pieces for technical analysis.
*** Two technical indicators that we have seen work are long-term moving averages and the relative strength index ("RSI")...
Like support and resistance, these indicators measure buying and selling.
While many investors focus on the 50-, 100- or 200-day moving averages ("DMA"), I prefer the 375-DMA. With roughly 250 trading days in a year, the 375-DMA is essentially the 18-month moving average. It shows long-term trends.
A positive trend in the 375-DMA indicates more buyers than sellers in the market. A stock trading above this level is likely to stay above this level. (Of course, the opposite is also true.)
Remember, the market is a voting mechanism. In the same way music fans decide on what makes a great band, it's sometimes hard to know exactly why investors are buying a stock... But by looking at the 375-DMA, we can see all we need to know – that they are buying.
We look to buy stocks that the market is responding to and that others are interested in buying... because they tend to keep going up!
The other powerful technical analysis tool we use is the RSI. This is a 14-day measure of the "momentum" of price. In other words, the RSI shows the excitement of buyers versus sellers.
Take Altria (MO), for instance...
From April to late September, shares of the tobacco giant got crushed. The Centers for Disease Control and Prevention and Food and Drug Administration had recently launched a widespread investigation following a spate of "cases of lung injury associated with the use of e-cigarette or vaping products."
The news spooked investors, who flooded out of the stock... pushing its RSI to its lowest level in five years. As I told my Empire Elite Trader readers in late September, the last seven times Altria had gotten that oversold, shares were up 13% just three months later.
I recommended buying the stock at the time and closed the trade for a 15% gain less than a month later – or 199% on an annualized basis.
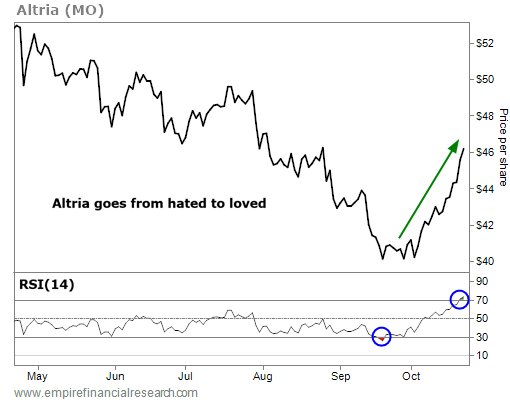
Unlike the long-term moving average, the RSI is a contrarian indicator... When investors get super-excited (and the RSI goes above 70), the stock gets overheated and is likely to move sideways or drift lower.
Conversely, if they get too pessimistic (and the RSI falls below 30), investors are in "panic" mode. And more often than not, they'll soon exhaust themselves. This sets the stock for a short-term rally.
These two technical indicators are proven, powerful moneymaking tools.
*** Next up is the concept of "buying low and selling high"...
This is probably the most common – and least followed – saying in the markets.
Mathematically, we know it's the only way to make money in the markets. But when push comes to shove, our emotions take over and make it almost impossible to execute.
To overcome this, we used a simple methodology at my hedge funds: We analyzed a situation for both the risk and reward to determine our position-sizing.
Let's say a stock is trading at $30 per share, and you think it's worth a 5% position in your portfolio. If the stock trades up to $40, you have a position worth about 6.5%. If nothing else changes, you should trim your position, as it isn't as attractive at $40 as it was at $30.
Conversely, if nothing else changes and it trades down to $20, you have a position worth around 3.4%. Here, not only should you buy enough to make it a 5% position again, but it's now even more attractive. So in theory, you should buy even more.
The idea is basic. But when the time comes, investors – professionals and amateurs alike – can't bring themselves to do it.
*** When a position goes against you, it triggers a powerful chemical reaction inside of you...
Human beings are shaped by our biology. Our bodies produce chemicals that determine many of our actions (like dopamine, which allows us to experience pleasure).
As much as man has evolved, we are biologically and chemically the same as cavemen were millions of years ago. When we encounter the prospect of pleasure or pain, our caveman brains take over.
We as humans are naturally risk-averse. Faced with a 1% chance of a fatal event, our body produces a huge chemical reaction. The problem for investors is that the potential of losing money triggers the same type of chemical response, which overwhelms any rational plan we might have had.
It doesn't matter that you've worked hard to maintain your investment discipline around a well-researched idea and have spent hundreds of hours to come up with a plan – 200,000 years of human biology and survival instincts inevitably get in the way.
No wonder traders are overwhelmingly bad when it comes to actually buying low and selling high.
*** The fifth and final rule that actually works is what I call "operational momentum"...
Companies are giant, complex organizations that often have thousands (sometimes even hundreds of thousands) of employees.
Again, to make an analogy to sports, we must think about the players' talent (employees) and coaches' ability (management) when we consider investing in a company.
What's the key to identifying when management will win the "championship" (i.e., when its stock will soar)?
Here's something you'll almost never hear from anyone on Wall Street: I have no idea!
It's almost impossible for most investors to identify a good management team. If you haven't worked at that company or in that industry, how would you really know?
What we can determine, though, is whether the business is winning...
Remember, investors keep "score" through a rising and falling share price. Companies and management teams do it through operational metrics, like revenue and earnings.
It's important to look at not only how a company and management are doing, but also how they are doing versus expectations.
A company that grows its revenue and earnings is a great prescription to make a lot of money in the stock market. Where you see even greater performance, though, is when the company beats expectations.
Now, Wall Street estimates aren't particularly accurate, and they don't mean much. But like it or not, it's how the market keeps score.
The best-performing stocks always come from companies that are growing revenue and earnings and beating analyst expectations, regardless of valuation.
Take my recent recommendation of fitness chain Planet Fitness (PLNT), for instance. This is a company that has beaten analyst expectations every single quarter since it has gone public. Take a look at the revenue revisions plotted alongside the stock price...
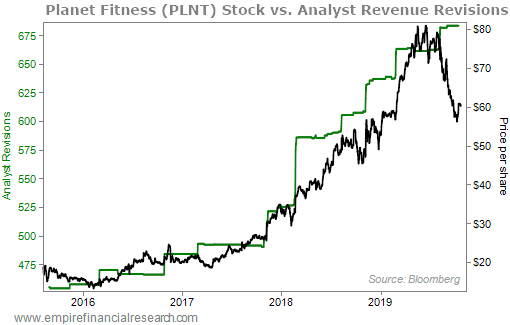
When it went public, PLNT shares were trading at almost 40 times earnings per share ("EPS"). At its "cheapest" level, it still traded for more than 20 times EPS. That's certainly not cheap by any traditional measure... And yet, the stock is up roughly 300% since it went public in August 2015.
This works for all types of stocks, both cheap and expensive. It's the single most important variable I've seen in my investing career.
*** I've gone on long enough, but I would like to end on one final note...
I recently joined Empire Financial Research after several compelling conversations with my dear friend Whitney Tilson.
The investment research industry seemed like a natural fit for me... In addition to running a digital media company, I had been the editor in chief of the second-largest newspaper at the University of Pennsylvania. My funds had also been known for writing informative and entertaining investor letters over the years.
As much as I love the markets and investing, I've always enjoyed discussing ideas and interacting with – and educating – other investors.
My goal is to take my 20-plus years of frontline investment experience, along with my real-world business experience, and turn that into profitable stock ideas for my subscribers.
With that said, I'm doing something special...
Right now, you can sign up to try out Empire Elite Trader for 30 days... completely free. Not risk-free. Free-free. You'll be able to read through everything – my brand-new special report... all of my issues and updates... everything I publish for the next 30 days – all without paying a penny.
Take the next 30 days to decide if you like my trading philosophy. See how much money I can help you make. If it's not right for you, simply cancel within the first 30 days. We won't charge you a thing. Get started right here.
Regards,
Enrique Abeyta
Editor's note: Our friends at Empire Financial Research are making a special deal for DailyWealth readers. They've agreed to extend the deadline on an offer to "test drive" Empire Elite Trader. Right now, you can still get instant access to all of Enrique's research and trades for 30 days without paying a single penny. Learn more here.
